Politicians treat so-called "gun violence" as a lever issue, hoping to energize their base and guilt law-abiding Americans into supporting policies that would have no effect on crime or help the mentally ill. Part of this effort entails presenting as large a number of fatalities as possible, and so researchers, the media, and anti-gun politicians combine suicide, homicide, accidents, legal interventions, and incidents in which the intent is unknown.
They’ve chosen to sensationalize tragedies time and again to advance an anti-freedom agenda. The media misrepresents old data by using current-tense headlines. Anti-gun organizations the Brady Campaign and Moms Demand Action politicized memorial services held the day after a shooting when the community wanted a chance to mourn properly. Anti-gun politicians ignore pre-existing trend data if it means they can claim gun control works – no matter how many caveats are included in the underlying analysis.
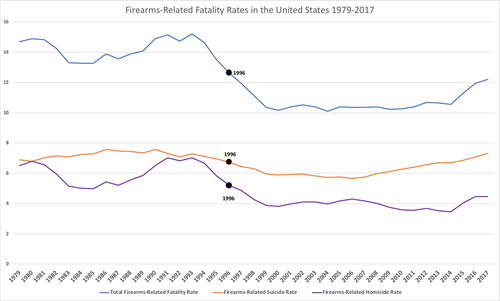
What does “gun violence” really look like? CDC non-fatal injury data is not reliable, but fatality statistics are accurate. The most recent data available is for 2017; there were 39,772 total firearms-related fatalities. Sixty percent were suicides. Thirty-seven percent were homicides, which is a rate of 4.5 fatalities per 100,000 people. The rate held steady between 2016 and 2017, but it has increased slightly since the start of the decade. However, the 2017 rate is 34% lower than it was in 1980 and 36% lower than in 1993. In other words, the firearms-related homicide rate dropped by 36% in the last 25 years for which we have data. Rates don’t tell the whole story; the total population grew by more than 99 million people from 1980 to 2017 and the number of firearms-related homicides decreased by 958.
Let’s look at the specific wording used in a recent article supporting gun control. “In 2017, the United States had the highest rate of firearm fatalities since 1996.” This statement is specifically crafted to make a dramatic point. The rate of all firearms-related fatalities in 1996 was lower than it was in the previous 15 years, and the rate was lower every year from 1997 through 2016. The data tell a clear story, even in the presence of a recent and moderate increase. Perhaps more importantly, the data shows that suicide is increasing as a percentage of all firearms-related fatalities.

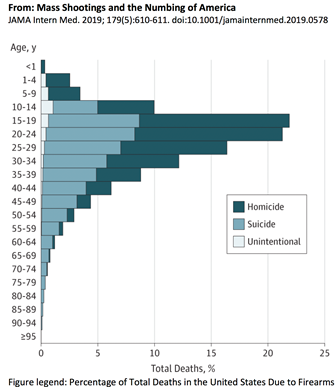
Not all charts are as clear. Some seem designed to support a certain perspective rather than to present data without bias. Doctor Eric Fleegler, affiliated with Harvard Medical School and Boston Children’s Hospital, recently published the above-referenced article titled, “Mass Shootings and the Numbing of America” in JAMA Internal Medicine. He presented firearms-related fatalities by age group and intent. The bars represent the percentage of all fatalities within that age group that involve firearms.
 This representation is technically correct, but it suggests at first look that there are more firearms-related fatalities among younger people, specifically those within the 15-19-year-old and 20-24-year-old age groups. The chart really indicates what is not shown: that younger people face fewer potentially fatal injuries and health complications than older generations. In other words, younger age cohorts are generally healthier than older people, some of whom unfortunately pass away due to falls, to heart disease, cancer, or any number of other issues that are not common among teenagers and young adults.
This commentary is not designed to trivialize any deaths, but efforts to address firearms-related fatalities should be targeted and the data needs to be considered sincerely. Unfortunately, we too often see the presentation of data sensationalized to make a point. But, that’s the shell game that anti-gun activists and politicians want to play.


 More Like This From Around The NRA


